Tool sensors, electronics, and digital monitoring help users track tool performance, detect unusual changes, manage maintenance, and improve work quality. They turn physical signals into useful data that supports better decisions.
On construction sites, in American factories, and inside professional workshops, tools must work well under changing conditions. A cordless drill may face heavy loads during a long shift. A table saw may run for hours in a dusty shop. A production machine may need to hold a steady speed for thousands of cuts. Sensors and electronic controls help users understand how these tools perform.
A tool sensor measures something that happens during use. It may track heat, vibration, speed, force, current, or movement. Electronic parts read these signals and turn them into data. A display, mobile app, or computer can then show the results. Some systems also send alerts when a tool moves outside its set limits.
Digital monitoring can help crews spot wear before a tool fails. It can also show how often a tool runs and how much work it handles. Yet a sensor cannot explain every fault on its own. A high heat reading, for example, may come from a heavy load, poor airflow, a worn part, or a bad sensor. Good monitoring combines data with sound checks, proper care, and the tool maker’s instructions.
This guide explains how tool sensors work, what the main electronic parts do, and how to use digital monitoring in a safe and useful way. It also covers data quality, common errors, system setup, and the limits of smart tool features.
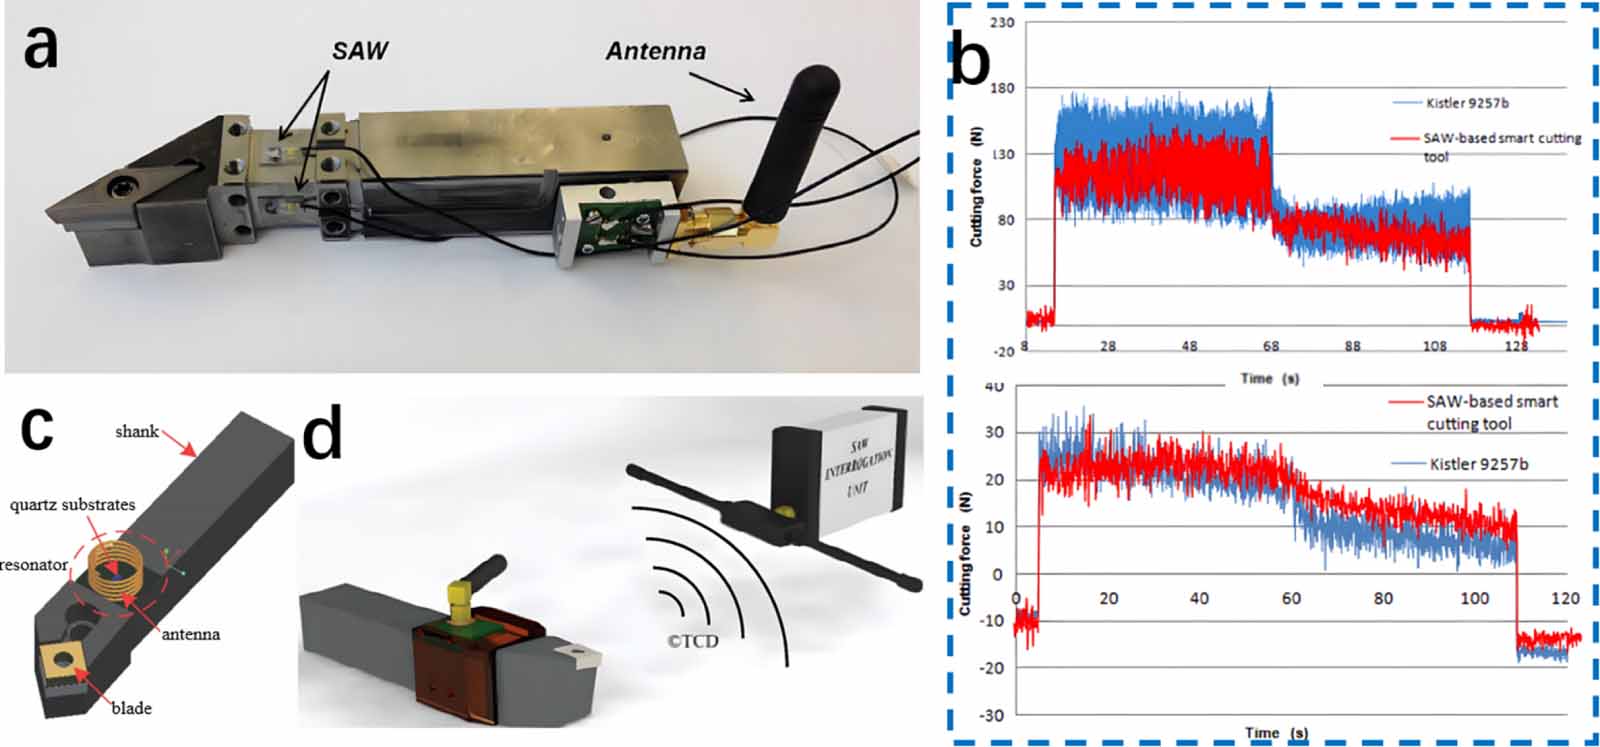
Source: iopscience.iop.org
What Are Tool Sensors and Digital Monitoring Systems?
A tool sensor is a small device that measures a physical or electrical condition. It may sit inside a tool, near its motor, on a tool holder, or beside a machine. Its job is to detect a change and send a signal to an electronic system.
Digital monitoring uses that signal to show what is happening. The system may display a live reading, save past data, or send an alert. Some tools show only basic values on a screen. More advanced systems can send data to a phone, computer, or factory network.
Think of a sensor as a set of eyes and ears for a tool. It can notice changes that a user may not see at once. The electronic system acts like a reader. It turns those signals into information that people can use.
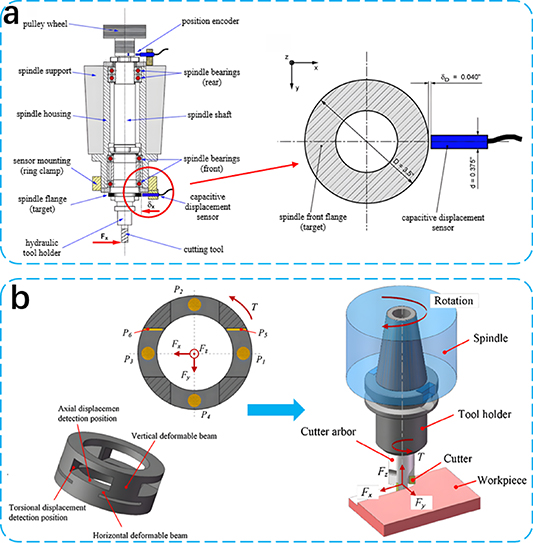
A full monitoring system often has four main parts. These parts work together, but each has a separate job. A fault in one part can affect the whole system.
Source: advancedmanufacturing.org
Sensors
They measure heat, force, movement, speed, current, voltage, or other conditions. The sensor type must match the value that the system needs to track.
Electronic control unit
A small circuit or controller reads sensor signals, processes data, and may control a motor or other tool function.
Software and firmware
Firmware runs inside the tool. Software on a phone or computer may show readings, save records, and manage alerts.
Data connection
A wired link, wireless radio, or local memory moves or stores data. Some systems work without an internet connection.
Common Types of Sensors Used in Tools
Different sensors track different parts of tool performance. A drill may use current and heat data to watch motor load. A machine tool may use vibration and force data to check its cutting process. The best sensor depends on the job and the problem that users want to solve.
No single sensor can measure every part of tool health. A useful system may combine two or more sensor types. This can give a clearer view of what is happening during work.
Source: iopscience.iop.org
Temperature sensors
These sensors track heat near a motor, battery, bearing, or electronic part. A rising reading may point to excess load, poor cooling, friction, or a fault. The sensor location matters because one part can run hotter than another.
Vibration sensors
Accelerometers measure movement and vibration. They can help track changes linked to loose parts, poor balance, worn bearings, or chatter during cutting. A change in vibration is a warning sign, not proof of one exact fault.
Current and voltage sensors
These sensors track electrical use. Current data may help show how hard a motor works. Voltage data can help reveal supply or battery issues. The readings must match the tool’s design and electrical limits.
Speed and position sensors
These sensors track rotation, travel, or movement. They help control motor speed and show whether a part moves as expected. They are common in powered equipment and automated machines.
Force and torque sensors
These sensors measure a push, pull, or turning force. They can help monitor machining loads and fastening work. Motor current alone should not be treated as a direct torque reading unless the tool system has been designed and checked for that use.
Pressure sensors
These sensors measure pressure in systems that use air, fluid, or hydraulic power. A change may point to a leak, blockage, poor supply, or a worn part.
Sound sensors
Microphones and acoustic sensors can track sound patterns. A change in sound may help flag unusual contact, impact, or machine noise. Dust, nearby tools, and room noise can affect the reading.
How to Match a Sensor to a Tool
Start with the problem, not the sensor name. If a drill gets hot, a temperature sensor may help. If a machine starts to shake, vibration data may be more useful. If a motor slows under load, speed and current readings may help explain the change.
Also check the sensor range, accuracy, response time, and mounting needs. A sensor that cannot handle the heat or vibration near a motor may give poor data or fail early. The maker’s technical guide should list the allowed use and fit.
Match the measurement
Choose a sensor that measures the condition linked to the fault or work goal.
Check the range
Make sure the sensor can read the full range that the tool may reach during normal use.
Check the fit
Confirm that the sensor can be placed without blocking airflow, guards, moving parts, or service access.
How Tool Electronics Turn Signals Into Useful Data
A sensor first detects a physical change. It then sends an electrical signal to a circuit. The circuit reads that signal and prepares it for use by the tool or monitoring software. This process helps turn a small change in the real world into a value that a person can read.
Many sensors produce an analog signal. An analog signal can change across a range of values. An analog-to-digital converter, or ADC, changes that signal into digital data. A small controller can then read the data and apply set rules.
Some systems also use signal filters. These filters reduce unwanted noise in the data. For example, a vibration sensor may pick up movement from nearby machines. Filtering can help separate useful patterns from random changes. Poor filter settings, however, can hide real events.
The controller may also use firmware to manage tool functions. It can limit speed, watch motor load, or stop a process when a set condition occurs. These functions depend on the tool design. Users should not assume that every sensor-based tool has the same level of control.
Source: mdpi.com
Signal reading
The circuit receives the sensor signal and checks its value. The quality of this step affects the quality of all later data.
Data processing
The controller may smooth readings, find changes, and compare values with set limits.
Local storage
Some tools save readings in internal memory. This can help users review work even when a network is not available.
Wireless or wired transfer
The system may send data through Bluetooth, Wi-Fi, a cable, or an industrial network. The exact method depends on the product.
User display
A screen, app, or computer shows the readings in a form that users can understand and act on.
Why Sampling Rate Matters
A sensor system takes readings at set times. This is called its sampling rate. A slow rate may be enough to track room temperature or daily tool use. A faster rate may be needed to study quick vibration or impact events.
A high sampling rate also creates more data. That can use more storage and power. It may also make a system harder to manage. The right rate depends on the event being measured and the needs of the user.
Slow changes
Temperature trends and battery state may need less frequent readings.
Fast changes
Impact, chatter, and sudden vibration may need faster data capture.
Data limits
Use a rate that captures the event without creating more data than the system can handle.
What Digital Monitoring Can Tell You About Tool Performance
Digital monitoring gives users a view of tool use over time. A basic system may show battery level or motor temperature. A larger system may track runtime, load, vibration, fault codes, and service history. The value comes from seeing how these readings change during real work.
For a U.S. contractor, this data may help manage tools across several job sites. A shop manager may use it to see which machines run most often. A factory team may use it to spot changes in a cutting process. Each case needs a clear goal and a plan for how staff will use the data.
A trend is often more useful than one reading. A tool that runs at a steady heat level may be working as designed. A tool with a slow rise in heat over many shifts may need a closer check. The trend does not name the cause, but it can help set the next step.
Source: iopscience.iop.org
Tool usage
Runtime records can help show how often a tool is used. They may support tool sharing, stock planning, and service schedules.
Performance changes
Changes in speed, load, or vibration may show that a tool no longer works in its usual way.
Fault alerts
Alerts can tell a user when a reading crosses a set limit. A trained person should check the tool before deciding what caused the alert.
Maintenance planning
Usage and condition records can help teams plan checks and service. They can also help spot tools that need more attention.
Work process review
Data can show changes in cycle time, idle time, and tool load. This may help teams review work methods and machine settings.
Condition Monitoring and Predictive Maintenance
Condition monitoring checks the state of a tool while it works or rests. It uses sensor data to find changes that may need attention. Predictive maintenance takes this a step further by using past patterns and current readings to estimate when service may be needed.
These systems do not know the exact future of every part. A warning may show that a tool needs an inspection, not that it will fail on a set date. A good maintenance plan still uses maker guidance, service records, visual checks, and skilled judgment.
For example, a machine may show a gradual rise in vibration. A maintenance worker can inspect the mount, bearing, workpiece, and tool holder. The sensor helps direct the check, while the physical inspection helps find the cause.
Early warning
A trend may help users spot a change before the tool stops working.
Better service timing
Usage data may help plan service around real work needs rather than guesswork alone.
Human review
A trained person must confirm the fault and decide what repair or service is safe.
How to Set Up a Tool Monitoring System
A useful monitoring system starts with one clear goal. Do not add sensors just because a tool can support them. First, decide what problem needs to be solved. It may be repeated motor heat, poor tool use records, sudden vibration, or missed service checks.
Before setup, collect the tool manual, sensor details, wiring rules, and software needs. Check if the tool supports the sensor or app. Some systems work only with certain tool models, battery platforms, or software versions. A device that looks similar may not share the same data link.
The steps below offer a general setup path. Follow the tool maker’s instructions for the exact model. Electrical work, internal changes, and safety control changes should be handled by qualified people.
Source: iopscience.iop.org
Step 1: Set a clear goal
Choose one issue to track. Define what a useful result would look like, such as fewer missed service checks or better records of tool runtime.
Step 2: Pick the right sensor
Match the sensor to the value you need. Check its range, accuracy, response time, power needs, and approved mounting method.
Step 3: Check tool compatibility
Review the tool manual and system details. Confirm the tool model, firmware, app, battery, and network needs before you buy or install anything.
Step 4: Install the system safely
Use only approved mounting points and parts. Keep sensors clear of moving parts, guards, vents, and hot surfaces unless the design allows that location.
Step 5: Set a normal baseline
Record how the tool behaves during known normal work. Include the tool, task, material, speed, load, and room conditions where they affect the reading.
Step 6: Set useful alerts
Use limits that fit the tool and task. Avoid copying alert values from a different model or work process.
Step 7: Test the data path
Check that readings reach the screen or app. Confirm the time, tool ID, units, and saved records are correct.
Step 8: Train the users
Show workers what each alert means, who should review it, and when work must stop for a safe check.
Signs That the Setup Is Working
A good setup gives clear readings that match the work being done. The system should show the correct tool, time, and units. It should also save data when the tool runs and show alerts in a way that users can act on.
The system should not create a new safety risk or slow work without a clear benefit. If workers ignore alerts because they appear too often, the limits or sensor setup may need review.
Correct readings
The values make sense when compared with known tool conditions and approved test methods.
Stable connection
Data reaches the intended display or storage system without repeated gaps.
Clear alerts
Users know what an alert means and what action they must take.
Useful records
The saved data helps with maintenance, work review, or tool management.
What to Do When Monitoring Fails
If a reading looks wrong, do not change the tool settings at once. First, check the sensor connection, power supply, display units, and data link. Compare the reading with an approved method if one is available.
If data is missing, check the battery, wireless range, network status, and storage limits. If readings jump without a clear cause, inspect the sensor mount and look for nearby vibration or electrical noise. Stop using the tool if there is a sign of a real fault or an unsafe condition.
No reading
Check power, cable connections, sensor status, and the correct tool selection in the app.
Unusual reading
Check the sensor location, calibration status, units, and work conditions.
Repeated false alerts
Review the baseline, alert limits, sampling method, and sensor fit with a qualified person.
No wireless data
Check range, pairing, network access, and software compatibility. Use local records if the system supports them.
How to Read Sensor Data and Avoid False Alerts
A sensor value has meaning only when users know the conditions around it. A motor may draw more current when it cuts thick stock than when it runs without a load. A saw may vibrate more when it cuts a hard material. These changes may be normal for the task.
Compare readings from similar work. Use the same tool, material, setup, speed, and load where possible. If those details change, record them. This helps users avoid treating a normal work change as a fault.
Look at the size and length of a change. A short spike may come from a single impact or a loose data point. A steady rise across many work cycles may need more attention. The best response depends on the tool maker’s limits and the risk of the work.
Check the unit
Confirm whether the display shows degrees, volts, amps, speed, force, or another value. A wrong unit can lead to a wrong decision.
Check the sensor location
A sensor near a motor may show a different heat level from one near a battery or bearing.
Check the work condition
Material, feed rate, tool bit, load, and room conditions can all affect the reading.
Check the time trend
Review past readings to see if the change is short, repeated, or steady.
Confirm before repair
Use the approved inspection method to find the cause before replacing parts.
A Simple Data Quality Check
One useful check is the percentage of expected records that the system saved. Divide the number of valid records by the number of expected records, then multiply by 100. This shows how complete the data set is.
For example, a system should save 1,000 records during a set test. It saves 950 valid records. The data capture rate is 95 percent. This does not prove that the sensor is accurate, but it does show that 50 expected records are missing.
Formula
Data capture rate = valid records divided by expected records, multiplied by 100.
Example
950 valid records divided by 1,000 expected records equals a 95 percent capture rate.
What it means
A high capture rate shows fewer missing records. Accuracy still needs a separate check against a trusted reference.
Tool Monitoring for Job Sites, Workshops, and Factories
The best monitoring plan depends on where the tool works. A small repair shop may need simple runtime records. A construction crew may need to track tools across several sites. A factory may need live data from machines that run for long periods.
On U.S. construction sites, tools may move between crews, trucks, and work areas. Digital tool records can help managers see who has a tool and when it was last checked. Yet location tracking and worker data need clear rules. Teams should explain what they collect and who can view it.
In a woodworking shop, vibration and load data may help track changes in a saw, planer, or router. The data may also help review work methods. It does not replace a sharp blade, a sound fence, dust control, or proper machine setup.
In a factory, several sensors may feed a central monitoring system. This can help teams compare machines and spot changes across a production line. The data needs a clear owner. Someone must review alerts, plan service, and keep records in good order.
Construction crews
Focus on tool use, battery status, location where allowed, inspection records, and service needs.
Woodworking shops
Focus on machine load, vibration, speed, dust system status, and changes in work quality.
Auto repair shops
Focus on tool runtime, battery health, service history, and approved electronic tool functions.
Manufacturing plants
Focus on process trends, machine condition, cycle time, faults, and planned maintenance.
Common Mistakes With Smart Tools and Electronic Monitoring
Smart tool features can help, but poor use can make the data less useful. A system may collect many values without helping anyone make a better choice. Good monitoring needs a clear purpose and a simple response plan.
The most common mistake is to treat every alert as a confirmed fault. A sensor can detect a change, but it may not know why the change happened. Users should check the tool and the work conditions before they choose a repair.
Another mistake is to trust a sensor without checking its condition. A loose sensor, damaged cable, weak battery, or old calibration can affect the data. Regular checks help keep the system useful.
Using one limit for every tool
Different tool models and tasks may have different normal ranges. Use limits that fit the exact tool and work.
Ignoring the work process
A change in material, speed, feed, or load may change sensor readings. Record these changes before judging the tool.
Adding too many sensors
Extra sensors can raise cost, data load, and service needs. Add only those that support a clear goal.
Skipping calibration checks
A sensor can drift or become damaged. Follow its maker’s test and service rules.
Ignoring software needs
An app may need updates, a supported phone, a network, or a paid service. Check these needs before relying on it.
Treating data as a safety device
Monitoring does not replace guards, safe work steps, lockout procedures, or other required safety controls.
Safety, Data Security, and Sensor Maintenance
Tool electronics must be used within the limits set by the maker. Do not drill into a tool case, change internal wiring, or add a sensor near moving parts unless the design allows it. These changes may damage the tool or create an electrical or mechanical hazard.
Before cleaning, inspecting, or servicing a powered tool, follow its manual. Disconnect the power source when the service method calls for it. Remove or isolate the battery as directed. For fixed machines, use the site’s approved energy control and lockout procedures.
A digital alert should never be the only safety check. If a tool has a cracked case, damaged cord, loose guard, strange noise, smoke, or signs of overheating, stop using it and follow the proper inspection process. Do not keep working just because the app shows a normal value.
Connected tools may store tool IDs, work records, location data, and user details. A company should decide who can view this data and how long it should be kept. Use strong account access, supported software updates, and approved network settings. Do not share work data through personal accounts without permission.
Sensor care also needs a regular plan. Dust, oil, water, impact, and heat can affect sensor parts and their connections. Clean them only by approved methods. Keep records of checks, repairs, firmware changes, and calibration where the system requires it.
Keep safety parts in place
Never remove or bypass guards, interlocks, or other safety features to fit a sensor.
Protect electrical parts
Use only approved chargers, cables, batteries, and service parts for the tool.
Check sensor condition
Look for loose mounts, damaged wires, dirt, moisture, and signs of impact.
Control data access
Give access only to people who need the records for their work.
Keep service records
Save relevant checks, repairs, software changes, and sensor test results.
Ask a qualified technician
Get professional help for internal electrical faults, damaged battery systems, failed controls, or unclear safety alerts.
How to Decide Whether Digital Tool Monitoring Is Worth It
Digital monitoring makes sense when the data can help solve a real work problem. A small shop may not need a cloud system for every hand tool. A plant with costly machines may gain more from live condition data and planned service records.
Look at the full cost. Include sensors, software, network parts, setup, staff training, repairs, and future updates. Also consider the time needed to review alerts. A system that collects data but has no clear owner may add work without giving much value.
Start with one tool or one machine group. Set a baseline and track a small number of useful values. Review the results after a fair period. Keep the system only if it helps users make better choices or manage work more clearly.
Choose basic monitoring
This may fit a small shop that needs battery status, runtime, and simple service reminders.
Choose connected monitoring
This may fit a crew or business that needs shared records, remote alerts, or tool tracking across sites.
Choose advanced condition monitoring
This may fit a factory or high-use machine shop that needs vibration, load, temperature, and process trend data.
Keep manual checks
A simple inspection log may be enough when tool use is low and the cost of a digital system is not justified.
A Practical Way to Measure Value
Compare the same work period before and after setup. Track missed service checks, unplanned stops, tool search time, and the time spent on manual records. Use the same work scope when making the comparison.
Do not credit every change to the sensor system. Staffing, work volume, material, and tool age may also affect the result. Record these limits so the review stays fair.
Maintenance
Check whether service tasks are easier to plan and complete on time.
Downtime
Review whether unexpected stops change after the system is put in place.
Tool use
Check whether records help staff find, share, and return tools.
Data quality
Check whether readings are complete, clear, and useful for the chosen task.
Next Questions Readers May Need to Answer
Choosing a sensor system is only the first step. Users may also need to know how to check accuracy, manage data, and keep the system working over time. The questions below are inferred next needs based on the setup and use process. They are not claims about verified search demand.
No live competitor pages, Search Console records, or customer support logs were inspected for this draft. Competitor coverage is therefore marked as not checked rather than described as missing. These questions offer a useful plan for future supporting content.
How do I know if a tool sensor is accurate?
Reader stage: Before and after setup. Basis: Inferred next need. Competitor coverage: Not checked. Reader benefit: Learn how to compare a sensor with a trusted reference and spot poor readings. Evidence needed: Sensor specifications, calibration instructions, and an approved test method. Priority: High. Placement: Sensor selection and data quality sections.
Can smart tools work without Wi-Fi?
Reader stage: System selection. Basis: Inferred next need. Competitor coverage: Not checked. Reader benefit: Understand local displays, internal storage, Bluetooth, and offline limits. Evidence needed: Exact tool and app manuals. Priority: High. Placement: Electronics and monitoring setup sections.
How often should tool sensors be checked?
Reader stage: After installation. Basis: Inferred next need. Competitor coverage: Not checked. Reader benefit: Build a useful sensor inspection and calibration plan. Evidence needed: Sensor maker guidance and tool service rules. Priority: High. Placement: Safety and maintenance section.
Can digital monitoring predict every tool failure?
Reader stage: Before buying or using a system. Basis: Inferred next need. Competitor coverage: Not checked. Reader benefit: Understand the limits of alerts and predictive maintenance. Evidence needed: Documented system functions and condition monitoring methods. Priority: High. Placement: Predictive maintenance section.
Who should have access to tool monitoring data?
Reader stage: Business setup and ongoing use. Basis: Inferred next need. Competitor coverage: Not checked. Reader benefit: Set clear rules for user access, location records, and data retention. Evidence needed: Company policy, software terms, and applicable privacy requirements. Priority: Medium. Placement: Data security section.
Frequently Asked Questions
Q
What sensors are commonly used in power tools?
Common sensor types include temperature sensors, current sensors, voltage sensors, accelerometers, speed sensors, and position sensors. Some advanced tools also use force or pressure sensors. The exact set depends on the tool design and its intended functions.
Q
Do smart power tools need an internet connection?
No. Some smart tools work with a local display or save data inside the tool. Others use Bluetooth to connect to a phone. Cloud features and remote monitoring may need internet access. Check the exact model and app requirements before buying.
Q
Can tool sensors detect a failing motor?
Sensors can help detect changes that may point to motor trouble. Heat, vibration, current, and speed data can all help with a check. However, no single reading proves that a motor has failed. A proper inspection is still needed to find the cause.
Q
How often should digital tool monitoring systems be maintained?
Follow the sensor and tool makers’ service instructions. Check mounts, wires, power, software, and data links at the required times. Some sensors also need calibration checks. The right schedule depends on the sensor type, work conditions, and system design.
Q
Are digital monitoring systems worth the cost for small workshops?
They can be useful when they solve a clear problem, such as poor tool tracking, missed service checks, or repeated machine faults. A small shop may only need basic runtime records and service logs. Compare the cost of the system with the time and work it can help save.
✦ Wrapping Up
Conclusion
Tool sensors, electronics, and digital monitoring help users see how tools work and how their condition changes. Sensors measure heat, vibration, force, speed, and electrical values. Electronic parts process those signals and send useful data to a screen, app, or control system.
The best system is not always the one with the most sensors or features. It is the one that measures the right things and helps people make sound decisions. Good setup, clear limits, regular checks, and trained users matter more than a long list of digital features.
For American contractors, workshops, and production teams, a simple start can be the best approach. Choose one tool, set one clear goal, and track a few useful values. Review the results before adding more sensors or expanding the system.
💡 Key Takeaway
Start by choosing one tool and one performance issue. Check the manufacturer’s sensor and software guidance, set a normal baseline, and test the data before using alerts to guide maintenance. Keep all safety checks and approved service methods in place.
Compare oscillating tool vs reciprocating saw to pick the right cutter for your project—speed, precision, and blade choices explained to help you decide fast.
Tool Replacement Parts Component Matching and Service Compatibility starts with your exact model, type, and part number. Avoid costly fit and safety errors.